Process Workspace
In NileDesk, the Process Workspace is the central hub for managing everything related to a specific template. Whether you’re working with a Process Flow, Board, Dataset, or Form, the workspace acts as a control center where you can access records, visualize data, generate reports, track performance, and configure automation options.
Instead of navigating across different modules, the workspace consolidates all essential tools in one place, allowing teams to organize, analyze, and act on data efficiently .
Workspace by Template Type
Each template type has its own workspace layout, tailored to its unique use case:
- Process Flow Workspace → Designed for structured workflows and approvals.
- Board Workspace → Optimized for Kanban-style task management.
- Dataset Workspace → Built for structured tables and record-keeping.
- Form Workspace → Focused on form-based data collection and processing.
Workspace Tabs & Sections
These workspace include multiple tabs that group related functionality:
- Documents Tab → View items in list view with filters and system fields.
- Board Tab → Kanban-style visualization of steps and items.
- Overview Tab → High-level snapshot of status, overdue tasks, and key metrics.
- Charts Tab → Create and access charts for data visualization.
- Reports Tab → Generate tabular or pivot table reports.
- PDFs Tab → Design and export printable documents.
- Performance Tab (Process Flow only) → Track workflow efficiency and user contributions.
Access to NileDesk’s Workspace features is entirely role-based. Tabs and actions only appear if the user has the required permissions. For example, a user without Charts access will not see the Charts Tab at all.
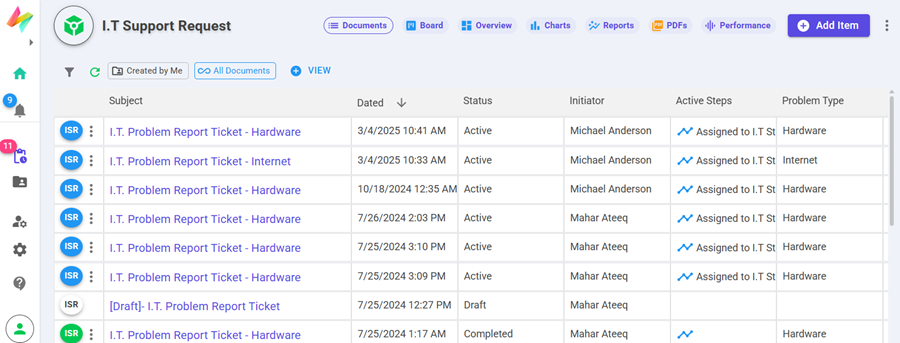
A. Documents Tab (List View)
The Documents Tab is where users view items from Process Flow and Board templates in a structured list/table view. It provides a quick way to scan records, apply filters, and perform item-level actions.
Overview
This tab is designed for efficiency. Users can quickly locate items, track their progress, and take actions directly from the table without needing to open the full form each time.
Key Features
- Customizable fields: Choose which process fields appear on items — you can show, hide, or reorder fields for document lists to tailor the view to your needs.
- Filtered Views:
- All Documents — shows all accessible records.
- Created by Me — shows only documents created by the current user.
- Custom Views — build and save personalized filters.
- Toolbar Actions: Refresh for latest updates and Filter for quick searches.
- Table Functionalities: Resizable columns, sortable headers, and visual status indicators.
- System Fields: Subject, Created At, Creator, Status / Active Steps.
- Item Operations: Context menu (⋮) with actions such as Fix Form Data, Re-Queue, Re-Open, Cancel, Event Log, Delete, and Show Process IDs.
Status Indicators
The first column shows a template abbreviation with a status color:
- Blue = Active
- Green = Completed
- Orange = Rejected
- White/Orange Strikethrough = Canceled
Extra Features
- Clickable Subject column opens the full form.
- Priority Flags can appear next to items to highlight urgency.
- Timeline Icon shows the complete process history.
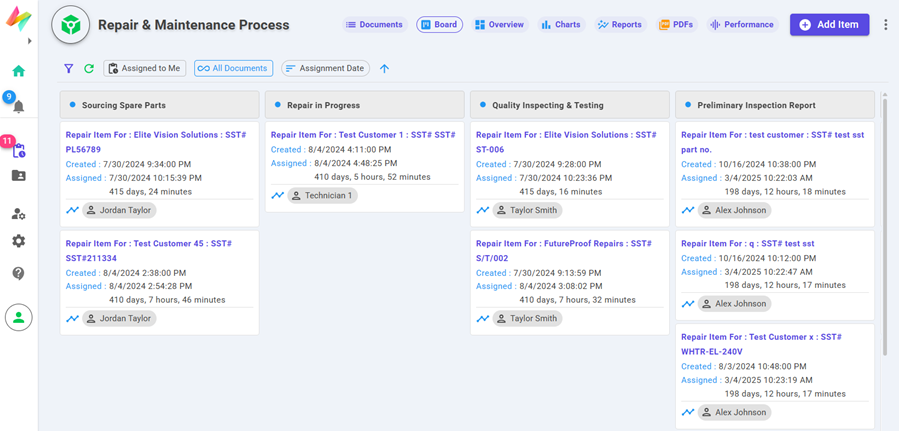
B. Board Tab (Kanban View)
The Board Tab provides a Kanban-style visual view of items, grouped by steps or columns. It is ideal for tracking progress at a glance and managing tasks through drag-and-drop.
Default Views
By default, users can switch between the following perspectives:
- Created by Me — shows items created by the current user.
- Assigned to Me — focuses on items where the user is responsible.
- All Documents — full view of all accessible items.
Board Behavior by Template Type
The behavior of the Kanban board depends on whether it is used with a Process Flow template or a Board template.
Process Flow Template
- Strict step-based workflow — items can only move forward or backward as defined in the process design.
- Drag-and-drop supported, but every move is validated by workflow logic (ensuring compliance).
-
Each card displays:
- Subject
- Priority
- Assignees
- Assignment Time
- Step Duration (time spent in the current step)
Board Template
- Flexible Kanban board — items can move freely across steps.
- Drag-and-drop allowed but checked against transition rules and permissions.
-
Each card displays:
- Subject
- Priority
- Assignees
- Creation Time
- Transition Time (last time the item was moved)
Usage Notes
- Drag-and-drop provides a fast way to update task progress while keeping compliance checks intact.
- Columns can represent workflow steps (Process Flow) or custom statuses (Board).
- Cards highlight priority visually, making urgent work easy to spot.
- Team members can quickly see who is assigned and how long a task has been pending.
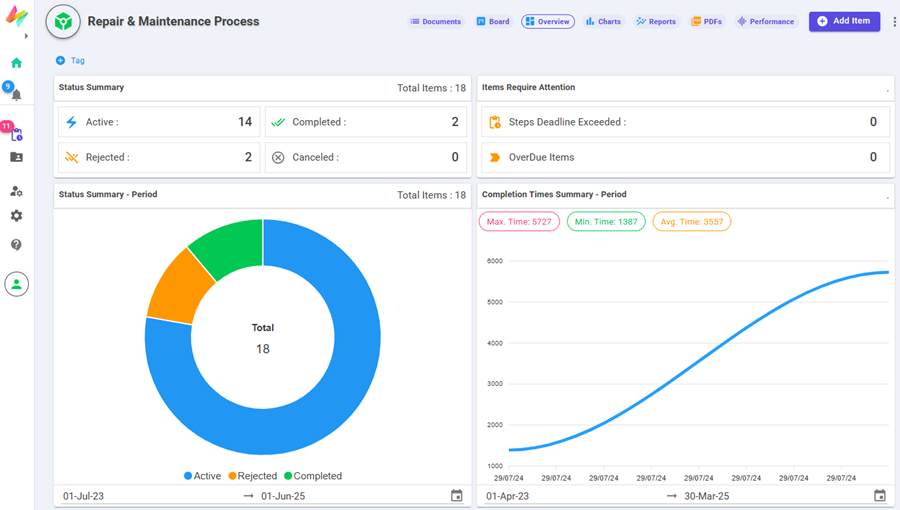
C. Overview Tab
The Overview Tab provides a quick snapshot of a template’s overall performance and current state. It is designed for at-a-glance insights with clickable elements that lead to deeper views.
Overview Tab Sections
Data Tags
Data Tags act as numeric trackers for key metrics. Example: “Pending Orders: 52”. They are displayed prominently for quick monitoring of important values.
Item Count by Status
- Active
- Completed
- Cancelled
- Rejected
- On-Hold (Boards only)
- Overdue
Each status count is interactive. Clicking on a status instantly applies the corresponding filters in the Documents Tab.
Charts Section
- Donut Chart → Visual distribution of items by status.
- Line Chart → Trends of completion times over the selected period.
A Date Range Selector is available (default = last 30 days) to refine the analysis. This allows users to focus on recent activity or historical trends as needed.
D. Charts Tab
The Charts Tab serves as the central hub for visualizing data inside NileDesk. It helps users transform raw records into meaningful insights using multiple chart types.
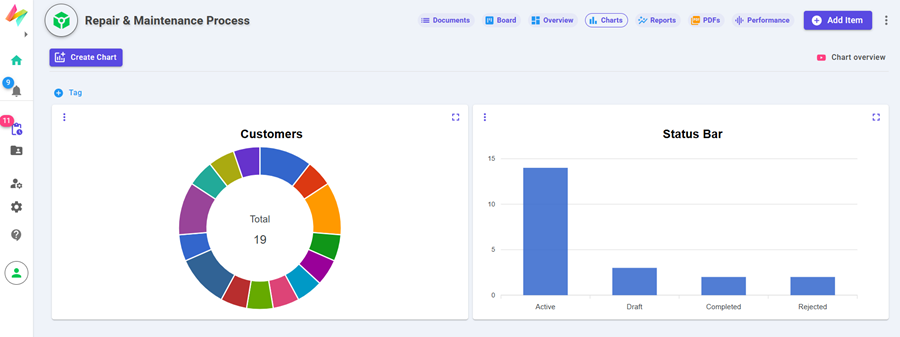
Features
- Create Bar, Pie, Line, Area, and Donut charts.
- Define custom X and Y fields for flexible data analysis.
- Example: build a “Sales by Month” chart to track revenue trends.
- Share charts with team members for collaborative reporting.
- Supports integration with Data Tags for displaying numeric KPIs.
E. Reports Tab
The Reports Tab provides structured insights into your data. It is designed for deeper analysis beyond charts, enabling detailed tables and pivot-based exploration.
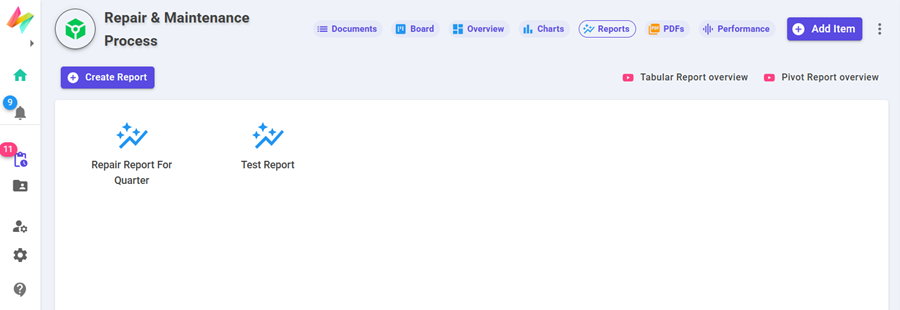
Types of Reports
Tabular Reports
- Structured tables with optional child table joins for detailed breakdowns.
- Not supported in Dataset/Form templates.
Pivot Table Reports
- Group, filter, and summarize data dynamically.
- Flexible configuration of rows, columns, and values.
Common Use Cases
- Analyze sales by region for performance tracking.
- Monitor and evaluate process efficiency.
- Compare workloads across teams to identify bottlenecks.
F. PDFs Tab
The PDFs Tab enables document generation and export within NileDesk. It allows you to design, generate, and distribute professional PDF files directly from your data.
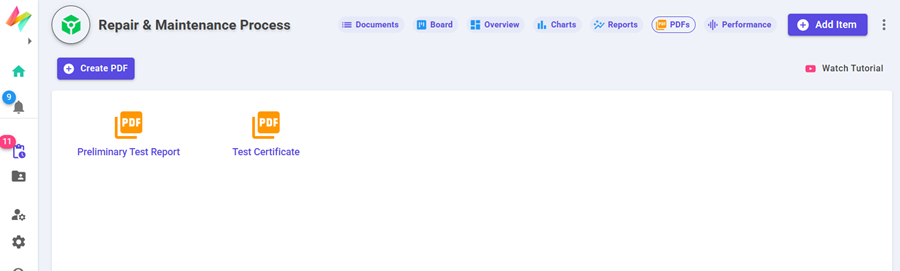
Features
- Create fully customizable PDF templates for any use case.
- Insert form fields, child tables, images, and signatures.
- Attach generated PDFs automatically to email notifications.
- Print or download PDFs on demand.
- Supported across all template types (Process Flows, Boards, Datasets, Forms).
Examples
- Invoices → Automatically generate billing documents.
- Certificates → Issue completion or achievement certificates.
- Customer Orders → Produce order confirmations with full details.
G. Performance Tab (Process Flow Only)
The Performance Tab is exclusive to Process Flow templates. It provides insights into workflow efficiency by analyzing both step-level performance and user activity.
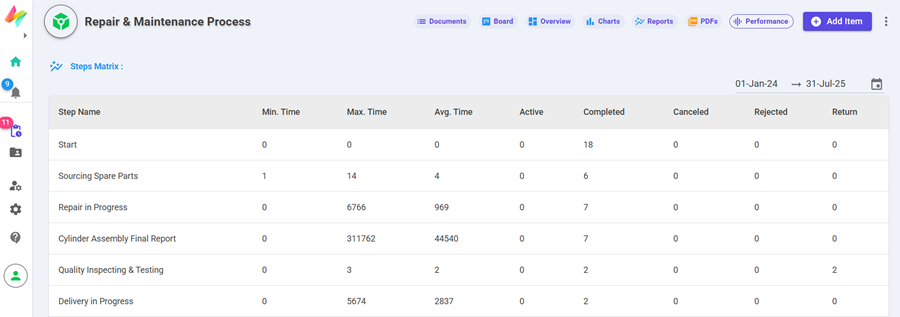
Sections
Step Performance
- Step Matrix → Displays minimum, maximum, and average completion times, along with counts of active, completed, and cancelled items.
- Step Aging → Shows how long items remain in each step, categorized into time bands (0–7 days, 8–15 days, … >180 days).
User Activities
- Tracks submissions, approvals, rejections, cancellations, and returns.
- Helps monitor individual and team productivity across workflows.